Install sequence for Oracle ASM libraries.
While installing, you can install the packages in the below order:
oracleasm-support
oracleasmlib
oracleasm-`uname -r
Please refer to below links:
http://www.oracle.com/technetwork/server-storage/linux/downloading-asmlib-176895.html
http://www.oracle.com/technetwork/server-storage/linux/uln-095759.html
Monday, December 22, 2014
Thursday, December 18, 2014
Oracle Log File Sync Wait Event
Oracle Log File Sync Wait Event
The Oracle “log file sync” wait event is triggered when a user session issues a commit (or a rollback). The user session will signal or post the LGWR to write the log buffer to the redo log file. When the LGWR has finished writing, it will post the user session. The wait is entirely dependent on LGWR to write out the necessary redo blocks and send confirmation of its completion back to the user session. The wait time includes the writing of the log buffer and the post, and is sometimes called “commit latency”.
The P1 parameter in is defined as follows for the log file sync wait event:
Reducing Oracle waits / wait times
If a SQL statement is encountering a significant amount of total time for this event, the average wait time should be examined. If the average wait time is low, but the number of waits is high, then the application might be committing after every row, rather than batching COMMITs. Oracle applications can reduce this wait by committing after “n” rows so there are fewer distinct COMMIT operations. Each commit has to be confirmed to make sure the relevant REDO is on disk. Although commits can be “piggybacked” by Oracle, reducing the overall number of commits by batching transactions can be very beneficial.
If the SQL statement is a SELECT statement, review the Oracle Auditing settings. If Auditing is enabled for SELECT statements, Oracle could be spending time writing and commit data to the AUDIT$ table.
If the average wait time is high, then examine the other log related waits for the session, to see where the session is spending most of its time. If a session continues to wait on the same buffer# then the SEQ# column of V$SESSION_WAIT should increment every second. If not then the local session has a problem with wait event timeouts. If the SEQ# column is incrementing then the blocking process is the LGWR process. Check to see what LGWR is waiting on as it may be stuck.
If the waits are because of slow I/O, then try the following:
- Reduce other I/O activity on the disks containing the redo logs, or use dedicated disks.
- Try to reduce resource contention. Check the number of transactions (commits + rollbacks) each second, from V$SYSSTAT.
- Alternate redo logs on different disks to minimize the effect of the archiver on the log writer.
- Move the redo logs to faster disks or a faster I/O subsystem (for example, switch from RAID 5 to RAID 1).
- Consider using raw devices (or simulated raw devices provided by disk vendors) to speed up the writes.
- See if any activity can safely be done with NOLOGGING / UNRECOVERABLE options in order to reduce the amount of redo being written.
- See if any of the processing can use the COMMIT NOWAIT option (be sure to understand the semantics of this before using it).
- Check the size of the log buffer as it may be so large that LGWR is writing too many blocks at one time.
Log file sync wait event: other considerations
There may be a problem with LGWR’s ability to flush redo out quickly enough if Oracle “log file sync” waits are significant for the entire system. The overall wait time for “log file sync” can be broken down into several components. If the system still shows high “log file sync” wait times after completing the general tuning tips above, break down the total Oracle wait time into the individual components. Then, tune those components that take up the largest amount of time.
The “log file sync” wait event may be broken down into the following components:
1. Wakeup LGWR if idle
2. LGWR gathers the redo to be written and issues the I/O
3. Wait time for the log write I/O to complete
4. LGWR I/O post processing
5. LGWR posting the foreground/user session that the write has completed
6. Foreground/user session wakeup
2. LGWR gathers the redo to be written and issues the I/O
3. Wait time for the log write I/O to complete
4. LGWR I/O post processing
5. LGWR posting the foreground/user session that the write has completed
6. Foreground/user session wakeup
Tune the system based on the “log file sync” component with the most wait time. Steps 2 and 3 are accumulated in the “redo write time” statistic. (i.e. as found under STATISICS section of Statspack) Step 3 is the “log file parallel write” wait event. (See Metalink Note 34583.1:”log file parallel write”) Steps 5 and 6 may become very significant as the system load increases. This is because even after the foreground has been posted it may take some time for the OS to schedule it to run.
Data Guard note
If Data Guard with synchronous transport and commit WAIT defaults is used, the above tuning steps will still apply. However step 3 will also include the network write time and the redo write to the standby redo logs. The “log file sync” wait event and how it applies to Data Guard is explained in detail in the MAA OTN white paper – Note 387174.1:MAA – Data Guard Redo Transport and Network Best Practices.
Final thoughts
When a user session waits on the “log file sync” event, it is actually waiting for the LGWR process to write the log buffer to the redo log file and return confirmation/control back to it. If the total wait time is significant, review the average wait time. If the average wait time is low but the number of waits is high, reduce the number of commits by batching (or committing after “n”) rows.
If slow I/O, investigate the following:
- Reduce contention on existing disks.
- Put log files on faster disks.
- Put alternate redo logs on different disks to minimize the effect archive processes (log files switches).
- Review application design, use NOLOGGING operations where appropriate, and avoid changing more data than required.
If wait times are still significant, review each component of the “log file sync” and tune separately.
Log file sync wait event - demystified
See How Easily you can Solve "Log File Sync" Wait Event ?
Log File Sync - I believe every Database Administrator has seen this wait event during his work. Few can solve log file sync wait Event easily but for other this could be a pain. Before going into how to solve log file sync wait event. Let's understand.
What is Log File Sync Wait Event ?
Whenever user issue a commit statement, LGWR start writing data from log buffer cache to redo log files. Starting from writing to redo log upto get back confirmation from LGWR that data is written in redo log file user session will wait into log file sync wait event. This is basically time when your data is getting written from log buffer to redo log files.
Whenever you see log file sync, I would suggest to take following and analyze.
1. OS Watcher: OS Watcher will give you a fair idea about over all load on the system. Check do you really has high load on system which can cause delay in system I/O process and finally high log file sync wait event. How to Analyze or Read OS Watcher Output in three easy steps ?
2. AWR Report: Next, collect at least two AWR Reports one for good time and another at time of high log file sync wait event. 30 minutes is the good time interval for AWR report, report has longer time interval doesn't help much to figure out root cause of the issue. Database administrator has to compare and Analyze these AWR repots.
3. Alert Log File: Alert log file of database shows how frequently redo logs are switching, recommended time for redo log switching is 15 to 20 minutes if database administrator find that redo log switching is happening more frequently. He should consider resizing redo log files.
How to Solve Log File Sync Wait Event ?
There could be so many reasons for Log file Sync wait event, Here I would explain most obvious reasons from them.
1. Slow Write on Hard Disk: One of the reason for Log file sync wait event could be slow write in to hard disk by LGWR process. To verify this DBA has to compare AVG wait of "log file sync" and "log file parallel write" wait event. Since log file parallel write is a part of log file sync wait event. So DBA has to check if Proportion of log file parallel write is high in log file sync if yes, this issue is due to disk I/O issue. In below AWR report snapshot

Total time wait for Log file sync is 868,667 and out of it 93,144 times it was waiting for log file parallel write wait event which is quite high. One more important criteria to major I/O is If an average time for 'log file parallel write' is over 20 milliseconds this means problem with IO subsystem.
Since you have confirmed the issue is with System I/O. DBA can take following steps to solve this.
1. Check if you are using Hard disk having redo log files for some other files, if yes move redo log files to a separate Hard disk which should not have any frequently accessed data.
2. Do not put redo logs on RAID 5.
3. Ensure that the log_buffer is not too big. A very large log_buffer can have an adverse affect as waits will be longer when flushes occur. When the buffer fills up,it has to write all the data into the redo log file and the LGWR will wait until the last I/O is completed.
4. Ask you network admin to look into and find out root cause of the issue.
2. Excessive Commits from Application: Sometimes Application running on the database also cause high log file wait events due to frequent issue of commit command. Every time user execute commit command LGWR write log buffer data into redo log files which initiate log file sync wait event.
To identify a high commit rate, if the average wait time for 'log file sync' is much higher than the average wait time for 'log file parallel write', then this means that most of the time waiting is not due to waiting for the redo to be written and thus slow IO is not the cause of the problem. The surplus time is CPU activity and is most commonly contention caused by over committing.
DBA can also see, In the AWR or Statspack report, if the average user calls per commit or rollback calculated as "user calls/(user commits+user rollbacks)" is less than 30, then commits are happening too frequently.
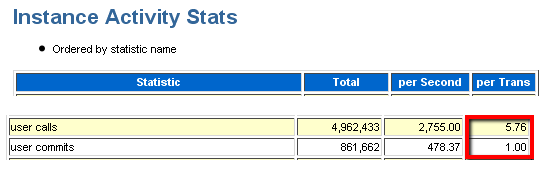
In the above example we see an average of 5.76 user calls per commit which is considered high - about 5x higher that recommended. Rule of thumb, we should expect at least 25 user calls / commit
Recommendations for reducing high Application commits:
1. If there are lots of short duration transactions, see if it is possible to group transactions together so there are fewer distinct COMMIT operations. Since it is mandatory for each commit to receive confirmation that the relevant REDO is on disk.
2. See if any activity can safely be done with NOLOGGING / UNRECOVERABLE options.
3. Talk to development team for making some modifications into application code to reduce high commits.
3. Redo Log file Size: If database redo log file size is not adequate, which cause high number log file switching. During log file switching process LGWR writes all log buffer data into redo log files and goes into log file sync wait event. To verify frequency of log file switching check alert log file which keep record of each log file switch. Recommended time for log file switch is 15 to 20 minutes. If you are seeing frequenct log file switch consider resizing redo log file size.
If you don't find any of the above issue matching your situation. Then there could be some known bugs into the database. I would suggest to open a Service Request with Oracle Support for further assistance.
Friday, November 7, 2014
How to generate a trace file for a SQL query
How to generate a trace file for a SQL query
set time on;
set timing on;
ALTER SESSION SET TRACEFILE_IDENTIFIER = "MY_TRACE2_SESSION";
ALTER SESSION SET EVENTS '10046 trace name context forever, level 8';
SET SERVEROUTPUT ON
SELECT * from emp;
ALTER SESSION SET EVENTS '10046 trace name context off';
set time on;
set timing on;
ALTER SESSION SET TRACEFILE_IDENTIFIER = "MY_TRACE2_SESSION";
ALTER SESSION SET EVENTS '10046 trace name context forever, level 8';
SET SERVEROUTPUT ON
ALTER SESSION SET EVENTS '10046 trace name context off';
Thursday, November 6, 2014
Orace performance tuning Master Note
Master Note: Database Performance Overview (Doc ID 402983.1)
| Purpose |
| Questions and Answers |
| Pro-Active Problem Avoidance and Diagnostic Collection |
| Performance Information Centres |
| Troubleshooting Guides |
| Common Problem Topics |
| Slow Database Performance |
| Concurrency Issues |
| Database Hangs/Spins |
| Session Hangs/Spins |
| Locking Issues |
| Deadlock |
| Pre-Upgrade Planning |
| Post-Upgrade Performance Issue Resolution |
| Debugging Waits for Various Events |
| Library Cache/Mutex Contention/Cursor Type Events: |
| Other Types: |
| Common Causes of Performance issues |
| Cursor Sharing/High Version Counts for Cursors |
| High CPU usage |
| Issues With waits for 'log file sync' |
| WAITED TOO LONG FOR A ROW CACHE ENQUEUE LOCK! |
| Buffer Busy/Cache Buffers Chains Latch waits |
| SYSAUX Issues |
| Performance Diagnostics References |
| General Diagnostics Overview |
| AWR/Statspack |
| 10046 Trace |
| Systemstates/Hanganalyze |
| Errorstacks for Performance Issues |
| PStack |
| PL/SQL Profiler |
| OS Watcher |
| LTOM |
| Trace/Result Interpretation |
| Performance (and other) Webcasts |
| Performance and Scalability White Papers and Documentation |
| Interacting With Performance Support |
| Community: Database Tuning |
| References |
Applies to:
Oracle Database - Standard Edition - Version 7.0.16.0 and laterOracle Database - Personal Edition - Version 7.1.4.0 and later
Oracle Database - Enterprise Edition - Version 6.0.0.0 and later
Enterprise Manager for Oracle Database - Version 8.1.7.4 and later
Information in this document applies to any platform.
Purpose
This Document provides an overview reference to content that pertains to the resolution of Performance issues affecting the whole database.
For the Database Performance Frequently Asked Questions FAQ,information regarding Performance Related Features or issues involving individual SQL statements, see:
For the Database Performance Frequently Asked Questions FAQ,information regarding Performance Related Features or issues involving individual SQL statements, see:
Document 1360119.1 FAQ: Database Performance Frequently Asked Questions
Document 1361401.1 Where to Find Information About Performance Related Features
Document 199083.1 Master Note: SQL Query Performance Overview
Document 1516494.2 Information Center: SQL Query Performance Overview
Document 398838.1 FAQ: SQL Query Performance - Frequently Asked Questions
Document 1361401.1 Where to Find Information About Performance Related Features
Document 199083.1 Master Note: SQL Query Performance Overview
Document 1516494.2 Information Center: SQL Query Performance Overview
Document 398838.1 FAQ: SQL Query Performance - Frequently Asked Questions
Questions and Answers
Pro-Active Problem Avoidance and Diagnostic Collection
Although some problems may be unforeseen, in many cases problems may be avoidable if signs are detected early enough. Additionally, if an issue does occur, it is no use collecting information about that issue after the event. For information on suggested preparations to avoid issues and in case diagnostics are required, see:
Document 1482811.1 Best Practices: Proactively Avoiding Database and Query Performance Issues
Document 1477599.1 Best Practices Around Data Collection For Performance Issues
Document 1477599.1 Best Practices Around Data Collection For Performance Issues
Performance Information Centres
Performance Information Centres provide access to various aspects of performance issues:
Document 1512292.2 Information Center: Database Performance Overview
Document 1516494.2 Information Center: SQL Query Performance Overview
Document 1516494.2 Information Center: SQL Query Performance Overview
Troubleshooting Guides
There are a number of troubleshooting guides that can help resolve various issues:
Document 1543445.2 Troubleshooting Assistant: Troubleshooting Performance Issues
Document 1542678.2 Troubleshooting Assistant: SQL Performance Issues
Document 1528847.1 Troubleshooting: Avoiding and Resolving Database Performance Related Issues After Upgrade
Document 60.1 Troubleshooting Assistant: Oracle Database ORA-00060 Errors on Single Instance (Non-RAC) Diagnosing Using Deadlock Graphs in ORA-00060 Trace Files
Common Problem Topics
Slow Database Performance
If the database is performing slowly see the following:Document 1362329.1 How To Investigate Slow Database Performance IssuesConcurrency Issues
If you have problems with the concurrency of transactions, initially treat this as a "Slow Database Performance" issue and refer to the following:Document 1362329.1 How To Investigate Slow Database Performance IssuesDatabase Hangs/Spins
If the database encounters what looks like a hang or a spin conditions refer to the following:Document 452358.1 How to Collect Diagnostics for Database Hanging Issues
Document 68738.1 No Response from the Server, Does it Hang or Spin?
Document 392037.1 Database Hangs. Sessions wait for 'resmgr:cpu quantum'Session Hangs/Spins
If an individual session appears to hang or spin conditions refer to the relevant sections in the following articles:Document 1362329.1 How To Investigate Slow Database Performance Issues
Document 352648.1 How to Diagnose high CPU usage problemsLocking Issues
If sessions encounter locking conflicts refer to the following:Document 1392319.1 Master Note: Locks, Enqueues and Deadlocks
Document 15476.1 FAQ about Detecting and Resolving Locking Conflicts
Document 62354.1 TX Transaction locks - Example wait scenarios
Document 33453.1 REFERENTIAL INTEGRITY AND LOCKINGDeadlock
ORA-60 is an application error which usually occurs because a consistent locking strategy has not been followed throughout an application.
Please refer to the following articles for more information:Document 1509919.1 Master Note for Database Error ORA-00060
Document 18251.1 OERR: ORA 60 "deadlock detected while waiting for resource"
Document 62365.1 What to do with "ORA-60 Deadlock Detected" Errors
Please ensure that you are encountering none of the conditions in these articles.
Pre-Upgrade Planning
For upgrades to 11g, there is a useful webcast entitled "11G Upgrade Best Practices" :
This recorded seminar provides an overview of tips and best practices for upgrading your database to 11G. It starts with general Challenges and Support Best Practices, but moves on to performance specifics such as AWR and STATSPACK, SQL Plan Management, and Real Application Testing.
This webcast can be found here:
For advice on planning your upgrade see:Document 785351.1 Oracle 11gR2 Upgrade Companion
Document 601807.1 Oracle 11gR1 Upgrade Companion
Document 466181.1 10g Upgrade Companion
Document 465787.1 Managing CBO Stats during an upgrade to 10g or 11g
For more general upgrade related information see:Document 1392633.1 Things to Consider before upgrading to 11.2.0.3 to avoid performance or wrong results
Document 1320966.1 Things to Consider before upgrading to 11.2.0.2 to avoid performance or wrong results
Document 1464274.1 Master Note for Real Application Testing Option
Document 762540.1 Consolidated Reference List Of Notes For Migration / Upgrade Service RequestsPost-Upgrade Performance Issue Resolution
To troubleshoot performance issues encountered after upgrading a database see:Document 1528847.1 Troubleshooting: Avoiding and Resolving Database Performance Related Issues After UpgradeDebugging Waits for Various Events
There are numerous articles to help you debug issues with wait event contention. The most common of these being:Library Cache/Mutex Contention/Cursor Type Events:
Document 1356828.1 FAQ: 'cursor: mutex ..' / 'cursor: pin ..' / 'library cache: mutex ..' Type Wait Events
Document 1377998.1 Troubleshooting: Waits for Mutex Type Events
Document 1349387.1 Troubleshooting 'cursor: pin S wait on X' waits
Document 1357946.1 Troubleshooting 'library cache: mutex X' waits.Other Types:
Document 1376916.1 Troubleshooting: "Log File Sync" Waits
Document 1342917.1 Troubleshooting 'latch: cache buffers chains' Wait Contention
Document 34405.1 WAITEVENT: "buffer busy waits" Reference Note
Document 223117.1 Troubleshooting I/O-related waits
Document 1415999.1 Troubleshooting: Virtual Circuit WaitsCommon Causes of Performance issues
Cursor Sharing/High Version Counts for Cursors
The failure to share cursors effectively can have a highly detrimental affect on a database. For example, having hundreds of versions of the same cursor is likely to be wasting space, is unlikely to promote good performance and, in extreme cases, can cause contention issues.
For issues linked to Cursor related waits see:Document 1356828.1 FAQ: 'cursor: mutex ..' / 'cursor: pin ..' / 'library cache: mutex ..' Type Wait Events
Also, see the following articles for more information and help with troubleshooting issues:Document 296377.1Troubleshooting: High Version Count Issues
Document 438755.1 High SQL Version Counts - Script to determine reason(s)
Document 62143.1 Understanding and Tuning the Shared PoolHigh CPU usage
In cases where CPU usage of individual sessions or the whole database is high, refer to the following:Document 352648.1 How to Diagnose High CPU Usage Problems to the Module Level
Document 273646.1 How to diagnose the high CPU utilization of ORACLE.EXE in Windows environment
Note that High CPU usage can be caused by many factors including contention for cursors (see above), inefficient SQL and may be associated with excessive buffer reads etc.Issues With waits for 'log file sync'
If your system is waiting for the redo log files to synchronise with the disk, the following articles can help:Document 1376916.1 Troubleshooting: "Log File Sync" Waits
Document 34592.1 WAITEVENT: "log file sync" Reference Note
Document 857576.1 How to Minimise Waits for 'Log File Sync'?
Document 1278149.1 High Log File Sync Wait Events, LGWR Posting Slow Write Times, Low IO Waits
Document 1064487.1 Script to Collect Log File Sync Diagnostic Information (lfsdiag.sql)
WAITED TOO LONG FOR A ROW CACHE ENQUEUE LOCK!
This Issue occurs when the database detects that a waiter has waited for a resource for longer than a particular threshold. The message "WAITED TOO LONG FOR A ROW CACHE ENQUEUE LOCK!" appears in the alert log and trace and systemstates are dumped.
Typically this is caused by two (or more) incompatible operations being run simltaneously. See:Document 278316.1 Troubleshooting: "WAITED TOO LONG FOR A ROW CACHE ENQUEUE LOCK!"Buffer Busy/Cache Buffers Chains Latch waits
Buffer Busy waits occur when a session wants to access a database block in the buffer cache but it cannot as the buffer is "busy".
Cache Buffers Chains Latch waits are caused by contention where multiple sessions waiting to read the same block.
Typical solutions are to look for SQL that accesses the blocks in question and determine if the repeated reads are necessary.Document 1342917.1 Troubleshooting 'latch: cache buffers chains' Wait Contention
Document 34405.1 WAITEVENT: "buffer busy waits" Reference Note
Document 155971.1 Resolving Intense and "Random" Buffer Busy Wait Performance Problems:
Document 163424.1 How To Identify a Hot Block Within The Database Buffer Cache
SYSAUX Issues
SYSAUX is a mandatory tablespace in 10g which stores all auxiliary database metadata related to various product options and features. Of particular interest to Performance is the storage of Automatic Workload Repository (AWR) data:Document 552880.1 General Guidelines for SYSAUX Space Issues
Document 1055547.1 SYSAUX Grows Because Optimizer Stats History is Not Purged
Document 387914.1 WRH$_ACTIVE_SESSION_HISTORY Does Not Get Purged
Document 554831.1 How to Control the Set of Top SQLs Captured During AWR Snapshot Generation
Document 1292724.1 SYSAUX Tablespace Grows Rapidly
Performance Diagnostics References
General Diagnostics Overview
Document 438452.1 Performance Tools Quick Reference Guide
Document 781198.1 Required Diagnostics for Database Performance IssuesAWR/Statspack
10046 Trace
Document 376442.1 Recommended Method for Obtaining 10046 trace for TuningSystemstates/Hanganalyze
Document 121779.1 - Taking a SYSTEMSTATE dump when you cannot CONNECT to Oracle.
Document 175006.1 Steps to generate HANGANALYZE trace files
Errorstacks for Performance Issues
Document 1364257.1 How to Collect Errorstacks for use in Diagnosing Performance IssuesPStack
Document 70609.1 How To Display Information About Processes on SUN SolarisPL/SQL Profiler
Document 243755.1 Implementing and Using the PL/SQL ProfilerOS Watcher
OS Watcher (OSW) is a collection of UNIX shell scripts intended to collect and archive operating system and network metrics to aid support in diagnosing performance issues.Document 301137.1 OS Watcher User GuideLTOM
The Lite Onboard Monitor (LTOM) is a java program designed as a proactive, real-time diagnostic platform and provides real-time automatic problem detection and data collection.Document 352363.1 LTOM - The On-Board Monitor User Guide
Document 461050.1 The LTOM Graph (LTOMg) User Guide
Document 461228.1 The LTOM Graph FAQ
Document 461052.1 LTOM System Profiler - Sample Output
Document 977975.1 Diagnose LTOM Connection Problems
Trace/Result Interpretation
The following articles can help with the interpretation of various diagnostics:Document 390374.1 - Oracle Performance Diagnostic Guide (OPDG)
Document 39817.1 Interpreting Raw SQL_TRACE and DBMS_SUPPORT.START_TRACE output
http://www.oracle.com/technetwork/database/focus-areas/performance/statspack-opm4-134117.pdf
Performance (and other) Webcasts
A series of Performance (and General Datbase topic) related webcasts, including topics such as SQLHC, SQLTXPLAIN and OSWBB, can be found here:
Document 1456176.1 Oracle Database Advisor Webcast Archives
Performance and Scalability White Papers and Documentation
Performance and Scalability White Papers:
http://www.oracle.com/technetwork/database/focus-areas/performance/index.html
For White papers concerning Real Application Testing (RAT) and SQL Performance Analyzer (SPA) see:
Document 1546337.1 Real Application Testing (RAT): Recommended White Papers
Links to the main Tuning and Performance documentation:
Document 1195363.1 Database Performance and SQL Tuning Documentation on OTN
Interacting With Performance Support
Document 210014.1 How to Log a Good Performance Service Request
Document 166650.1 Working Effectively With Global Customer Support
Document 166650.1 Working Effectively With Global Customer Support
Community: Database Tuning
A community has been set up for My Oracle Support (MOS) users moderated by Oracle. The goal of this community is to exchange database related Tuning knowledge and concepts. The community can be found via the following article:
Document 1383594.1 Collaborate With MOS Database Tuning Community Members
References
NOTE:1320966.1 - Things to Consider Before Upgrading to 11.2.0.2 to Avoid Poor Performance or Wrong ResultsNOTE:461228.1 - The LTOM Graph FAQ
NOTE:175006.1 - Steps to generate HANGANALYZE trace files (9i and below)
NOTE:18251.1 - OERR: ORA 60 "deadlock detected while waiting for resource"
NOTE:452358.1 - How to Collect Diagnostics for Database Hanging Issues
NOTE:199083.1 - * Master Note: SQL Query Performance Overview
NOTE:223117.1 - Troubleshooting I/O-related waits
NOTE:68738.1 - No Response from the Server, Does it Hang or Spin?
NOTE:387914.1 - WRH$_ACTIVE_SESSION_HISTORY Does Not Get Purged
NOTE:390374.1 - Oracle Performance Diagnostic Guide (OPDG)
NOTE:392037.1 - Database 'Hangs'. Sessions Wait for 'resmgr:cpu quantum'
NOTE:166650.1 - Working Effectively With Support Best Practices
NOTE:461050.1 - The LTOM Graph (LTOMg) User Guide
NOTE:1357946.1 - Troubleshooting 'library cache: mutex X' waits.
NOTE:352648.1 - How to Diagnose High CPU Usage Problems to the Module Level
NOTE:554831.1 - How to Control the Set of Top SQLs Captured During AWR Snapshot Generation
NOTE:398838.1 - FAQ: SQL Query Performance - Frequently Asked Questions
NOTE:465787.1 - How to: Manage CBO Statistics During an Upgrade from 10g or 9i into 11g
NOTE:376442.1 - * How To Collect 10046 Trace (SQL_TRACE) Diagnostics for Performance Issues
NOTE:39817.1 - Interpreting Raw SQL_TRACE output
NOTE:62365.1 - Troubleshooting "ORA-00060 Deadlock Detected" Errors
NOTE:785351.1 - Oracle 11gR2 Upgrade Companion
NOTE:857576.1 - How to Minimise Waits for 'Log File Sync'
NOTE:94224.1 - FAQ- Statspack Complete Reference
NOTE:70609.1 - How To Display Information About Processes on SUN Solaris
NOTE:977975.1 - Diagnose LTOM Connection Problems
NOTE:1055547.1 - SYSAUX Grows Because Optimizer Stats History is Not Purged
NOTE:34592.1 - WAITEVENT: "log file sync" Reference Note
NOTE:352363.1 - LTOM - The On-Board Monitor User Guide
NOTE:601807.1 - Oracle 11gR1 Upgrade Companion
NOTE:210014.1 - How to Log a Good Performance Service Request
NOTE:1377446.1 - * Troubleshooting Performance Issues
NOTE:243755.1 - Script to produce HTML report with top consumers out of PL/SQL Profiler DBMS_PROFILER data
NOTE:1528847.1 - Troubleshooting: Avoiding and Resolving Database Performance Related Issues After Upgrade
NOTE:1392633.1 - Things to Consider Before Upgrading to 11.2.0.3 to Avoid Poor Performance or Wrong Results
NOTE:466181.1 - Oracle 10g Upgrade Companion
NOTE:1361401.1 - Where to Find Information About Performance Related Features
NOTE:1362329.1 - How To Investigate Slow or Hanging Database Performance Issues
NOTE:1363422.1 - Automatic Workload Repository (AWR) Reports - Start Point
NOTE:1364257.1 - How to Collect Errorstacks for use in Diagnosing Performance Issues.
NOTE:163424.1 - How To Identify a Hot Block Within The Database Buffer Cache.
NOTE:1360119.1 - * FAQ: Database Performance Frequently Asked Questions
NOTE:552880.1 - General Guidelines for SYSAUX Space Issues
NOTE:1278149.1 - Intermittent Long 'log file sync' Waits, LGWR Posting Long Write Times, I/O Portion of Wait Minimal
NOTE:1195363.1 - Database Performance and SQL Tuning Documentation on OTN
NOTE:121779.1 - Taking Systemstate Dumps when You cannot Connect to Oracle
NOTE:62143.1 - Troubleshooting: Tuning the Shared Pool and Tuning Library Cache Latch Contention
NOTE:1415999.1 - Troubleshooting: Virtual Circuit Waits
NOTE:1064487.1 - Script to Collect Log File Sync Diagnostic Information (lfsdiag.sql)
NOTE:438452.1 - Performance Tools Quick Reference Guide
NOTE:438755.1 - High SQL Version Counts - Script to determine reason(s)
NOTE:461052.1 - LTOM System Profiler - Sample Output
NOTE:278316.1 - Troubleshooting: "WAITED TOO LONG FOR A ROW CACHE ENQUEUE LOCK! "
NOTE:15476.1 - FAQ: Detecting and Resolving Locking Conflicts and Ora-00060 errors
NOTE:1392319.1 - Master Note: Locks, Enqueues and Deadlocks (ORA-00060)
NOTE:155971.1 - Resolving Intense and "Random" Buffer Busy Wait Performance Problems
NOTE:1376916.1 - Troubleshooting: "log file sync" Waits
NOTE:1292724.1 - Suggestions if your SYSAUX Tablespace grows rapidly or too large
NOTE:62354.1 - Waits for 'Enq: Tx - Row Lock Contention' - Wait Scenario Examples
NOTE:1377998.1 - Troubleshooting: Waits for Mutex Type Events
NOTE:1383594.1 - Collaborate with MOS Database Tuning Community Members
NOTE:762540.1 - Consolidated Reference List Of Notes For Migration / Upgrade Service Requests
NOTE:1356828.1 - FAQ: 'cursor: mutex ..' / 'cursor: pin ..' / 'library cache: mutex ..' Type Wait Events
NOTE:1509919.1 - Master Note for Database Error ORA-00060 "deadlock detected while waiting for resource"
NOTE:781198.1 - Diagnostics for Database Performance Issues
NOTE:273646.1 - How to Diagnose High CPU Utilization of ORACLE.EXE in Windows Environment
NOTE:1342917.1 - Troubleshooting 'latch: cache buffers chains' Wait Contention
NOTE:1349387.1 - Troubleshooting 'cursor: pin S wait on X' waits.
NOTE:296377.1 - Troubleshooting: High Version Count Issues
NOTE:301137.1 - OSWatcher Black Box (Includes: [Video])
NOTE:33453.1 - Locking and Referential Integrity
NOTE:34405.1 - WAITEVENT: "buffer busy waits" Reference Note
Subscribe to:
Posts (Atom)