Top Metrics to Monitor in Your MySQL Database (Part 2)
By tracking the most useful metrics and reviewing them in the most informative way(s), we strike a balance between over-monitoring and firefighting unforeseen crises.
As a dba, your top priority is to keep your databases and dependent applications running smoothly at all times. to this end, your best weapon is judicious monitoring of key performance metrics. in a perfect world, you’d want to be up-to-date regarding every aspect of your database’s activity, i.e. how many events occurred, how big they were, precisely when they happened, and how long they took.
there certainly is no shortage of tools that can monitor resource consumption, provide instantaneous status snapshots, and generate wait analysis and graphs. the challenge is that some metrics can be expensive to measure, and, perhaps even more importantly, they can require a lot of work to analyze.
the purpose of part 2 of this blog series is to narrow down the field to those performance metrics that provide the most value for the effort, as well as present some tangible ways to capture and study them. it is by tracking the most useful metrics and reviewing them in the most informative way(s) that you will strike a balance between paranoid over-monitoring and firefighting unforeseen crises.
this topic is divided into two parts. in part 1 , we:
- examined the benefits of performance monitoring.
- outlined the main performance metric categories.
- listed the monitoring tools provided by mysql, i.e.:
- server variables
- performance schema
- sys schema
- learned how to monitor:
- transaction throughput
- query execution performance
this blog will focus on monitoring database connections and buffer pool metrics.
connections
connection manager threads handle client connection requests on the network interfaces that the server listens to. on all platforms, one manager thread handles tcp/ip connection requests. connection manager threads associate each client connection with a thread dedicated to it that handles authentication and request processing for that connection. manager threads create a new thread when necessary — but try to avoid doing so by consulting the thread cache first to see whether it contains a thread that can be used for the connection. when a connection ends, its thread is returned to the thread cache (if the cache isn't full). in this connection thread model, there are as many threads as there are clients currently connected.
it’s important to monitor your client connections because once the database server runs out of available connections, new client connections are refused!
the mysql connection limit defaults to 151, but it can be changed using the set statement, so it’s best to not assume anything. the connection limit is stored in the @@max_connections variable:
the connection limit can be set at any time like so:
to permanently set the connection limit so that it persists once the server is restarted, add a line like this to your my.cnf configuration file:
don’t be afraid to increase the number of max_connections significantly. according to mysql docs , production servers should be able to handle connections in the high hundreds or thousands! just bear in mind that there are some caveats when the server must handle a large number of connections. for instance, thread creation and disposal become expensive when there are a lot of them. in addition, each thread requires server and kernel resources, such as stack space. therefore, in order to accommodate many simultaneous connections, the stack size per thread must be kept small. this can lead to a situation where the stack size is either too small or the server consumes large amounts of memory.
the takeaway here is that your database server should have adequate amounts of processing power and memory to accommodate a large user base.
mysql provides a few good metrics for monitoring your connections:
| variable | what it represents | why you should monitor it |
threads_connected | the total number of clients that have currently open connections to the server. | provides real-time information on how many clients are currently connected to the server. this can help in traffic analysis or in deciding the best time for a server restart. |
threads_running | the number of threads that are not sleeping. | good for isolating which connected threads are actively processing queries at any given time, as opposed to connections that are open but are currently idle. |
connections | the number of connection attempts (successful or not) to the mysql server. | can give you a good idea of how many people and applications are accessing the database. over time, these numbers reveal busiest times and average usage numbers. |
connection_errors_internal | the number of connections refused due to internal server errors, i.e. failure to start a new thread or an out-of-memory condition. | although mysql exposes several metrics on connection errors, |
we can use the mysql show status command to show mysql variables and status information. here are a few examples:
aborted client and connections
every time a client is unable to connect, the server increments the aborted_connects status variable. unsuccessful connection attempts can occur for the following reasons:
- a client attempts to access a database but has no privileges for it.
- a client uses an incorrect password.
- a connection packet does not contain the right information.
- it takes more than
connect_timeoutseconds to obtain a connect packet.
if these kinds of things happen, it might indicate that someone is trying to break into your server! if the general query log is enabled, messages for these types of problems are logged to it.
if a client successfully connects but later disconnects improperly or is terminated, the server increments the aborted_clients status variable and logs an "aborted connection" message to the error log.
here’s how to view the number of aborted clients and connections:
connection errors
mysql does an outstanding job of breaking down metrics on connection errors into different status variables:
once all available connections are in use, attempting to connect to mysql will cause it to return a "too many connections" error and increment the connection_errors_max_connections variable. your best bet in preventing this scenario is to monitor the number of open connections and make sure that it remains safely below the configured max_connections limit.
fine-grained connection metrics such as connection_errors_max_connections and connection_errors_internal can be instrumental in pinpointing the source of the problem. the following statement fetches the value of connection_errors_internal :
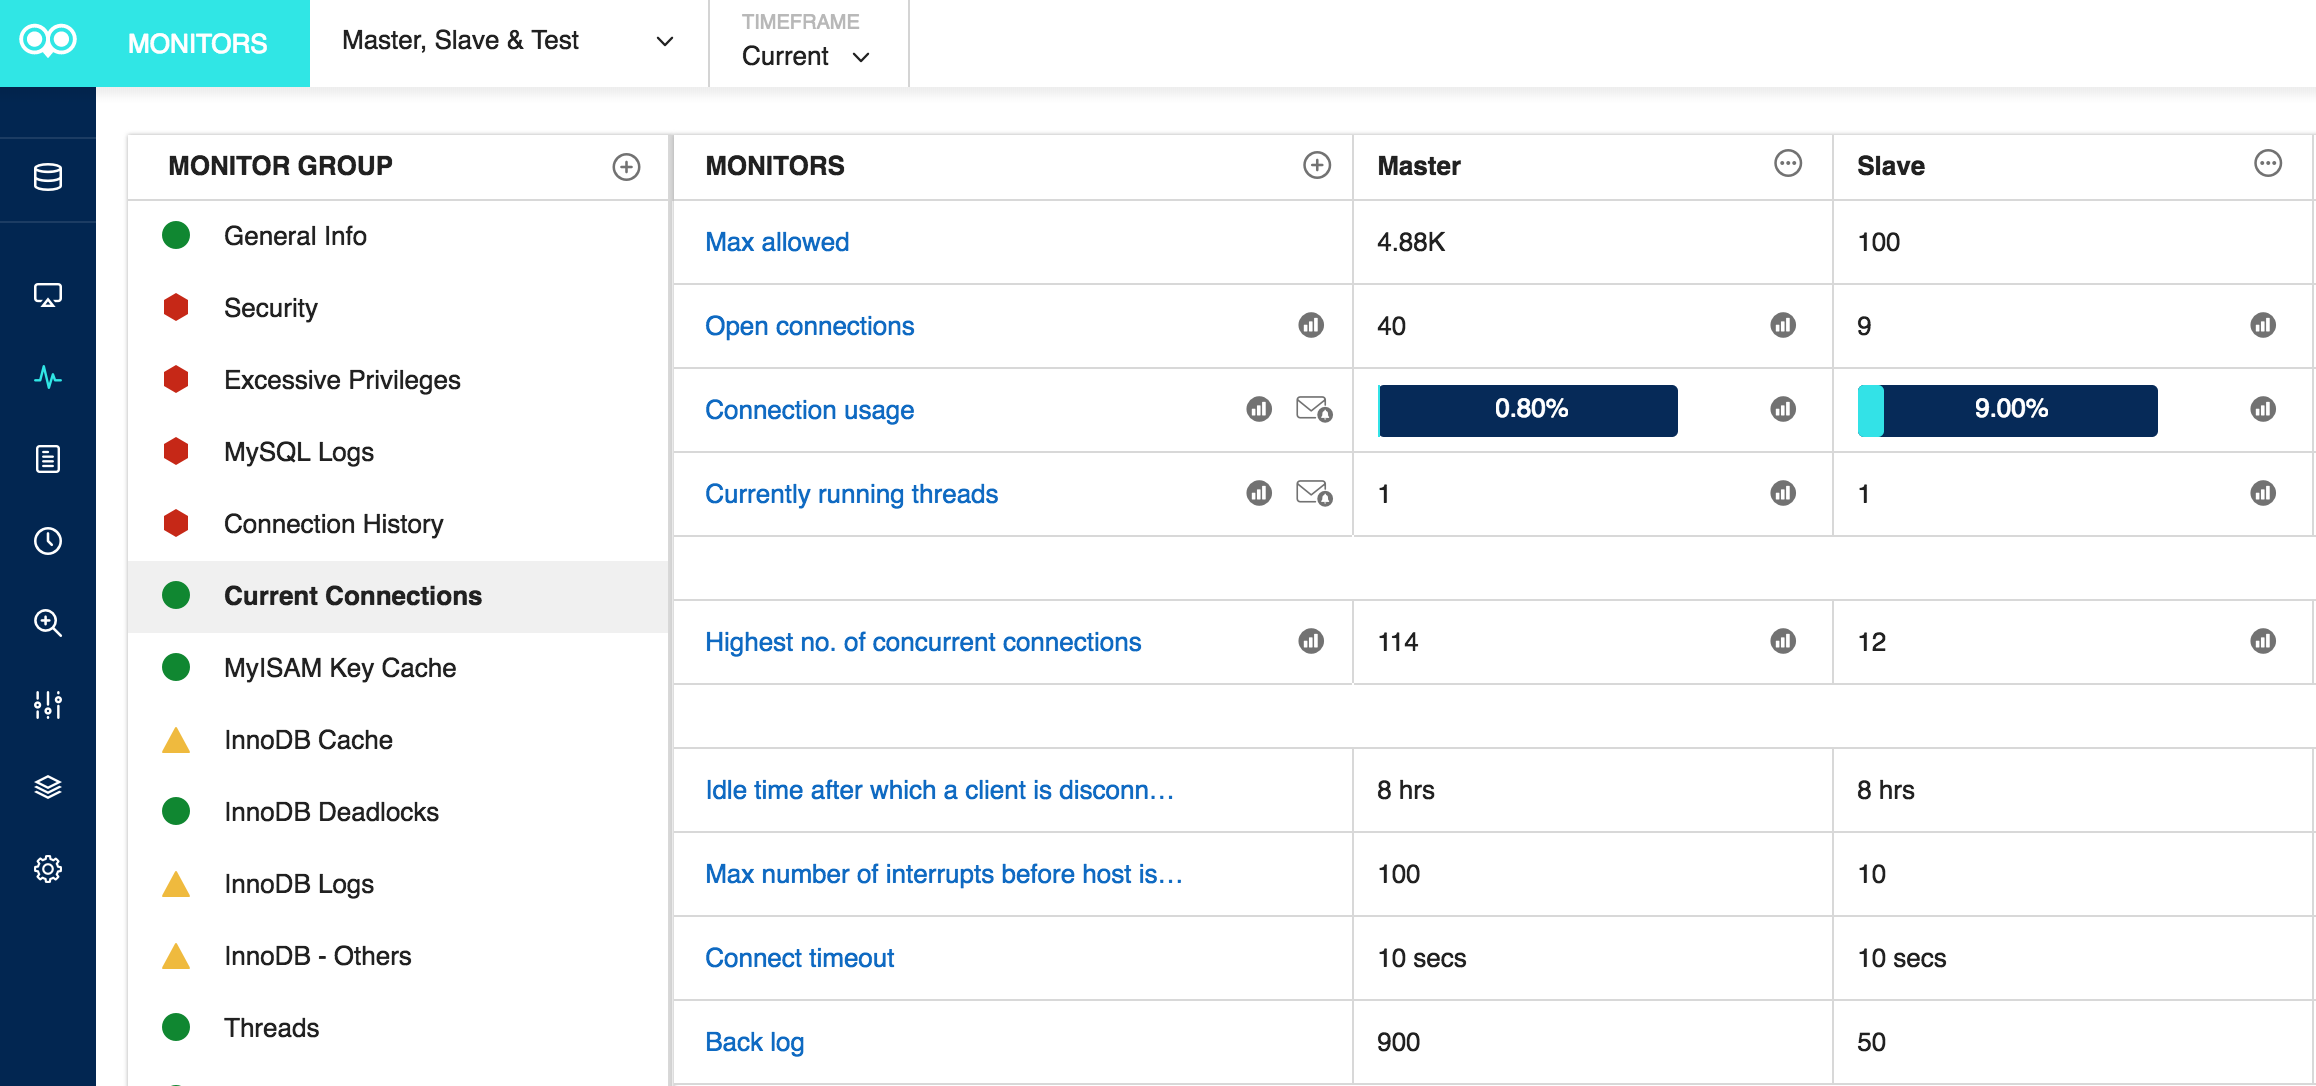
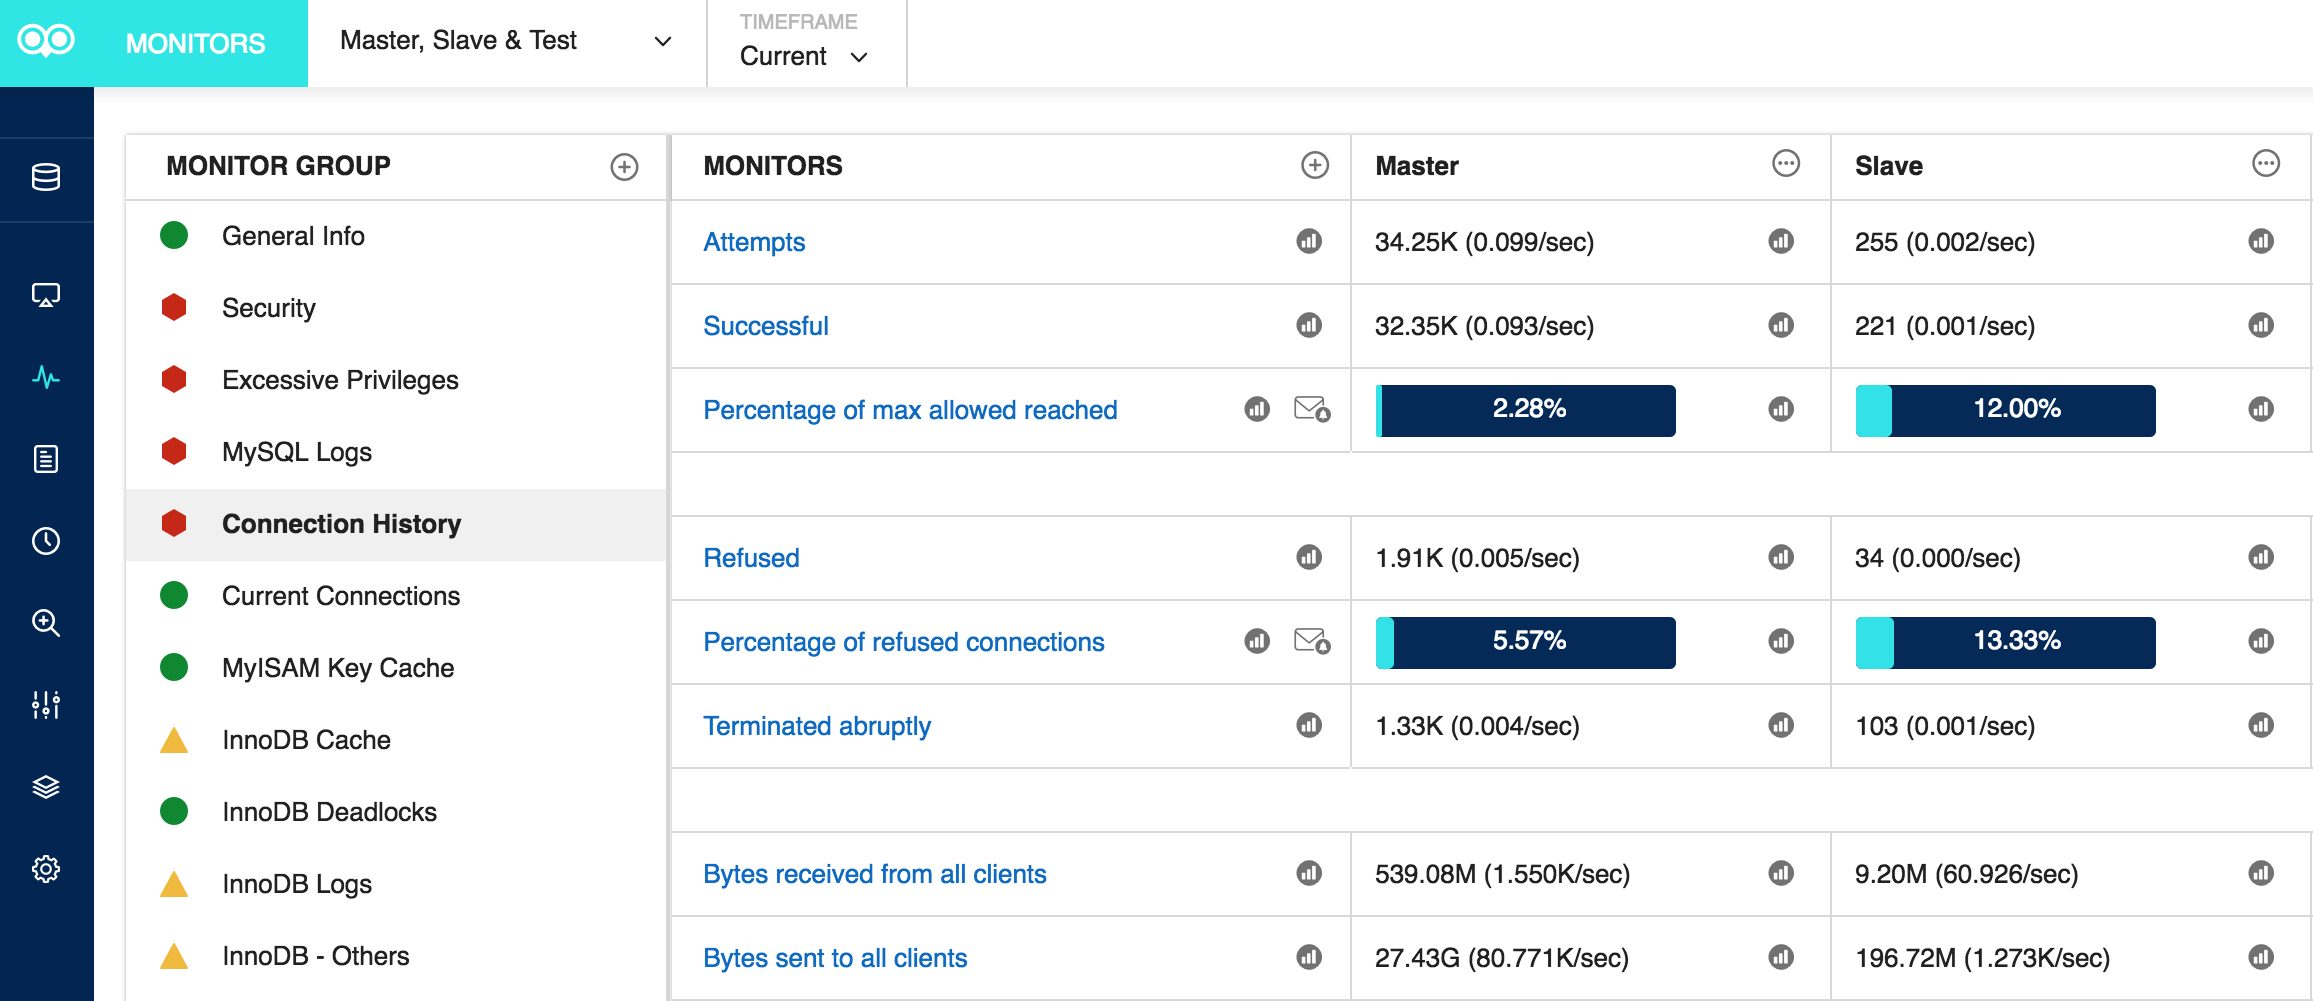
here are a couple of monyog screens that monitor current connections and the connection history, respectively:

monitor: current connection

monitor: connection history
buffer pool usage
mysql’s default storage engine, innodb , uses a special storage area called the buffer pool to cache data for tables and indexes. buffer pool metrics are categorized as resource metrics. as such, their main value is in the investigation, rather than the detection, of performance issues.
configuring the buffer pool
you can configure various aspects of the innodb buffer pool to improve performance.
the buffer pool defaults to a relatively small 128mb. ideally, you should increase the size of the buffer pool to as large a value as is practical, while leaving enough memory for other processes on the server to run without excessive paging. that typically amounts to about 80% of physical memory on a dedicated database server. the idea is that the larger the buffer pool, the more innodb acts like an in-memory database, reading data from disk once and then accessing the data from memory during subsequent reads.
please note:
- innodb’s memory overhead can increase the memory footprint by about 10 percent beyond the allotted buffer pool size.
- once the physical memory is exhausted, your system will resort to paging and performance will suffer significantly. hence, if database performance starts to degrade while disk i/o is rising, it might be time to expand the buffer pool.
buffer-pool resizing operations are performed in chunks, and the size of the buffer pool must be set to a multiple of the chunk size times the number of instances:
the chunk size defaults to 128mb but is configurable as of mysql 5.7.5. the value of both parameters can be checked as follows:
if querying innodb_buffer_pool_chunk_size returns no results, the parameter is not tunable in your version of mysql and can be assumed to be 128mb.
to set the buffer pool size and number of instances at server startup, invoke mysqld.exe with the following parameters:
as of mysql 5.7.5, you can also resize the buffer pool on-the-fly via a set command specifying the desired size in bytes. for instance, with two buffer pool instances, you could set each to 4gb by setting the total size to 8gb:
important innodb buffer pool metrics
innodb standard monitor output, which can be accessed using show engine innodb status , provides a number of metrics pertaining to operation of the innodb buffer pool, under the buffer pool and memory section. here is some typical content:
a word about the innodb buffer pool lru algorithm
in order to better understand what the above metrics mean, we should briefly review how the innodb buffer pool lru algorithm works.
innodb manages the buffer pool as a list, using a variation of the least recently used (lru) algorithm. when room is needed to add a new page to the pool, innodb evicts the least recently used page and adds the new page to the middle of the list. this “midpoint insertion strategy” treats the list as two sublists:
- at the head, a sublist of “new” (or “young”) pages that were accessed recently.
- at the tail, a sublist of “old” pages that were accessed less recently.
this algorithm keeps pages that are heavily used by queries in the new sublist. the old sublist contains less-used pages, which are candidates for eviction.
with that in mind, here are some of the more important fields in the innodb standard monitor output:
- old database pages : the number of pages in the old sublist of the buffer pool.
- pages made young, not young : the number of old pages that were moved to the head of the buffer pool (the new sublist), and the number of pages that have remained in the old sublist without being made new.
- youngs/s non-youngs/s : the number of accesses to old pages that have resulted in making them young or not. this metric differs from that of the previous item in two ways. first, it relates only to old pages. second, it is based on number of accesses to pages and not the number of pages. (there can be multiple accesses to a given page, all of which are counted.)
- young-making rate : hits that cause blocks to move to the head of the buffer pool.
- not : hits that do not cause blocks to move to the head of the buffer pool.
the young-making rate and not rate will not normally add up to the overall buffer pool hit rate.
some mysql performance tuning tips
if you see very low youngs/s values when you do not have large scans going on, that may be an indication that you have to either reduce the delay time for a block to be moved from the old to the new sublist, or increase the percentage of the buffer pool used for the old sublist.
if you do not see a lot of non-youngs/s when you are doing large table scans (and lots of youngs/s), try tuning your delay value to be larger.
the innodb_old_blocks_time global variable specifies how long in milliseconds (ms) a page inserted into the old sublist must stay there after its first access before it can be moved to the new sublist. if the value is 0, a page inserted into the old sublist moves immediately to the new sublist the first time it is accessed, no matter how soon after insertion the access occurs. if the value is greater than 0, pages remain in the old sublist until an access occurs at least that many milliseconds after the first access. for example, a value of 1000 causes pages to stay in the old sublist for 1 second after the first access before they become eligible to move to the new sublist.
the following statement sets the innodb_old_blocks_time to zero:
the innodb_old_blocks_pct global variable specifies the approximate percentage of the buffer pool that innodb uses for the old block sublist. increasing the old sublist percentage makes it larger, so blocks in that sublist take longer to move to the tail and be evicted. this increases the likelihood that they will be accessed again and be made young. the range of values is 5 to 95. the default value is 37 (that is, 3/8 of the pool).
when scanning small tables that do fit into memory, there is less overhead for moving pages around within the buffer pool, so you can leave innodb_old_blocks_pct at its default value, or even higher, such as innodb_old_blocks_pct=50 .
there are many other global status variables you can examine in addition to innodb_old_blocks_time and innodb_old_blocks_pct :
of these, some metrics will be more useful to you than others. standouts include:
- metrics tracking the total size of the buffer pool
- how much is in use
- how effectively the buffer pool is serving reads
the metrics innodb_buffer_pool_read_requests and innodb_buffer_pool_reads are integral to gauging buffer pool utilization. innodb_buffer_pool_read_requests are number of request to read a row from the buffer pool and innodb_buffer_pool_reads is the number of times innodb has to perform read data from disk to fetch required data pages. reading from memory is generally much faster than reading from disk, so keep an eye out for increasing innodb_buffer_pool_reads numbers!
buffer pool efficiency can be calculated using the formula:
here’s an example:
calculating the innodb buffer pool efficiency:
in this particular case, innodb is doing more disk reads, so the innodb buffer pool is not large enough.
buffer pool utilization is another useful metric to check. the utilization metric is not available as such but can be easily calculated as follows:
here’s an example:
plugging the numbers into our formula:
we can convert that into a percentage by multiplying by 100:
the fact that your database is serving a large number of reads from disk while the buffer pool is near empty is not in itself cause for celebration; it may be that your cache has recently been cleared and is still in the process of refilling. however, should this condition continues for an extended amount of time, it’s very likely that there is plenty of memory to accommodate your dataset.
high buffer pool utilization is not necessarily a bad thing either, as long as old data is being aged out of the cache according to the lru policy.
only when read operations are overpowering the buffer pool, should you start to seriously think about scaling up your cache.
converting buffer pool metrics to bytes
most buffer pool metrics are reported as a count of memory pages, which is not all that useful. luckily, page counts can be converted to bytes, which makes it a lot easier to determine the actual size of your buffer pool. for instance, this simple formula gives us the total size of buffer pool in bytes:
the innodb_page_size can be retrieved using a show variables query:
the most useful buffer pool metrics at a glance:

conclusion
in this final installment of two-part blog series, we learned how to capture and study mysql metrics that provide the most value for the effort. the main points covered include:
- client connection requests on the network interfaces that the server listens to are handled by the connection manager.
- it’s important to monitor your client connections because, once the database server runs out of available connections, new client connections are refused!
- every time a client is unable to connect, the server increments the
aborted_connectsstatus variable. - fine-grained connection metrics such as
connection_errors_max_connectionsandconnection_errors_internalcan be instrumental in pinpointing the source of connection problems. - mysql’s default storage engine, innodb, uses a special storage area called the buffer pool to cache data for tables and indexes.
- buffer pool metrics are categorized as resource metrics.
- you can configure various aspects of the innodb buffer pool to improve performance.
- innodb standard monitor output provides a number of metrics pertaining to operation of the innodb buffer pool.
- the least recently used (lru) algorithm employs a “midpoint insertion strategy” that treats the pages as “old” and “new” sublists.
- the lru algorithm can be tuned using the
innodb_old_blocks_timeandinnodb_old_blocks_pctglobal variables.
by tracking the most useful metrics and reviewing them in the most informative way(s), we strike a balance between over-monitoring and firefighting unforeseen crises.
No comments:
Post a Comment